Sunday, December 31, 2017

On Headphone Normalization Part 2

In Part 1 we have considered the need for headphone normalization and its implementation in Morphit plugin by Toneboosters. In this part, we will examine Sonarworks Reference.

Normalization with Sonarworks package

Sonarworks offers a package for recording studios called "Reference" which consist of room correction software, headphone correction filters, and system components that allow applying these corrections on a system wide level. For non-professionals, Sonarworks also offer "True-Fi" package which applies the same headphone correction curves using a simpler UI. For the purpose of writing this post, I've been playing with the implementation targeted to pro users, which offers more tuning capabilities.

I really like that the UI shows the grid for the response curves. It's also great that all 3 curves: source, correction, and target can be displayed on the graph.

However, Sonarworks doesn't offer the same degree of freedom for setting up the source and the destination frequency responses as does Morphit. The list of source responses only includes real headphone models, but no artificial curves like "flat at the eardrum." The list of target responses is even more limited, offering only a handful of speakers and headphones, which are presented like riddles, e.g. "A well respected open hi-fi and mastering reference headphone model nr.650 [...]" Illustrated by a picture of Sennheiser HD650 as a hint. I guess, this was done to work around some legal issues.

Here I have discovered the first curious thing—simulating HD650 using "HD650 Average" measurement didn't result in a flat compensation curve, and a similar thing with AKG K712:

I've asked a question about this on Sonarworks' support forum, and their representative confirmed my suspicion that the target curves in the package are not as up to date as the source averaged measurements.

Target Curve of Sonarworks

OK, first question has been resolved. The next important question—what does "Flat" target response mean for headphones. The UI doesn't help much, it indeed shows the target response as flat. But as we know from Part 1, it shouldn't really be flat at the earphone speakers.

My speculation is that since the package offers normalization for both headphones and speakers, the team has decided, they will represent the normalization from the speakers point of view. Thus, the "flat" target setting for headphones must be "as heard using speakers calibrated to flat response," but they did not specify under which conditions, and with which tweaks. As we have seen with the Harman Target Curve and Morphit, an honest "flat loudspeaker in a reference room as picked up at eardrum" may not be a preferred setting due to its "dullness."

In order to provide an educated guess, I've performed the following experiment. I've chosen the same headphone model—Shure SRH1540 as a source both in Morphit and Sonarworks, and normalized a test sweep signal separately using two plugins.

Then using "Trace Arithmetic" in Room Eq Wizard, I derived a transfer function for transforming Morphit's filter response into Sonarworks', and applied this transfer function to Morphit's "Studio Reference" curve. Here is the result compared to Morphit's "Studio Reference" (red) and "Studio Speaker" (which as we remember, resembles Harman Target Response) (blue). The Sonarworks' approximated response is a green curve.

Note that this is only approximation since measurement data for SRH1540 is obviously different between Morphit and Sonarworks (it's hard to perform headphone measurements reliably, especially at high frequencies).

But still, we can see similar shapes here, confirming that Sonarworks may be using something similar to either of the curves (and it's definitely not a "flat" target response as their UI suggests). Two remarkable differences can be seen though:

  • The response at high frequencies is rolling off. Indeed, the sound of normalized SRH1540 is duller with Sonarworks, unless additional treble adjustment is applied.
  • The bass is cranked up. Again, this can be heard very well. Though Sonarworks provides a bass control that allows +/-6 dB correction, which can fix this.

Note on the Implementation

Another interesting thing concerning the Sonarworks Reference package is that it can use different filter types for normalization. On the "Advanced" tab, there is a choice between "Zero Latency", "Optimum", and "Linear Phase" settings:

"Zero Latency" means applying a recursive (IIR) filter (as in Morphit), which has negligible latency but introduces some phase shifts.

"Optimum" is a shorter non-recursive minimum phase FIR filter of 500 taps, that at 44.1 kHz introduces a delay of about 11 ms—still OK for real-time operation.

"Linear Phase" is a longer FIR filter that achieves linear phase (no phase changes), but has longer processing time, and also adds some "pre-ringing."

Which Product to Choose

Personally, I've stuck with Morphit because it's cheaper, and allows me to see the target frequency response. On the other hand, Sonarworks offers a system-wide component that applies normalization to all system sounds. Although, this can also be achieved by means of using Morphit in conjunction with Audio Hijack Pro by Rogue Amoeba which allows applying plugins to system output, as well as capturing it.

Sonarworks also offers a service for measuring your personal headphones. However, I would prefer the headphones to be measured for my own head, not for a dummy head simulator, since factors as the shape of the pinna, and the shape of ear canals greatly affect the resonances that occur in the outer ear.

Tuesday, December 19, 2017

On Headphone Normalization

What is Headphone Normalization

The world of headphones is a jungle. There are thousands of headphone models on the market, each with its own sound signature. Every aspect of headphone build affects the sound. A lot of headphone makers also come up with their own "sound style", e.g. having lots of bass, or a "bright" sound, or neutral "studio reference" signature which is preserved along the model range.

Several factors comprise the sound signature: frequency response, added distortions, degree of matching between left and right drivers. Unlike the world of loudspeaker makers, which is moving towards the acceptance that the speaker frequency response should be a smooth slope downwards from low to high frequencies, the world of headphone manufacturers is still struggling to figure out the standard for the frequency response curve. The main reason for that is the fact that unlike the sound from loudspeakers, the sound emitted by headphones bypasses several "body filters" on its way to the eardrum.

The sound that we hear from outside sources partially reflects from the shoulders, and receives significant coloration from the outer ear. Thus, a sound from a loudspeaker with ideally flat frequency response being heard in an acoustically treated room is actually far from "flat" when picked up by the eardrum.

Now if we take in-ear monitor headphones that are inserted directly into the ear canal and radiate sound directly to the eardrum, and make their frequency response flat, what would be perceived by the listener is a sound with strongly attenuated vocals (because our outer ears do a great job of amplifying sound in the frequency range of vocals), not appealing at all. It had been understood that in-ear monitors thus need to have a frequency response curve that employs filtering applied by the shoulders and by the outer ear.

With over-ear headphones the situation is even more complicated because although they bypass the shoulders "filter", they still interact with the outer ear of the listener.

So it's universally been understood by the headphone manufacturers that headphones must have non-linear frequency response in order to sound pleasing, but there is still no universal agreement on the exact shape of the frequency response. Also, since most of the headphones are passive devices with no electronics inside, the target frequency response is determined by their physical make. Sometimes it can be challenging to achieve the desired frequency response by just tweaking materials and their shapes, and in cheaper headphone models the resulting frequency response is usually a compromise.

Here is where DSP normalization comes in. Since we listen to headphones via digital devices, we can put a processing stage before feeding the sound to the headphones in order to overcome the deficiencies of the headphones build, or to override manufacturer's preferred "signature."

I'm aware of two software packages that do such kind of processing: Morphit plugin by Toneboosters, and "Reference" package from Sonarworks. In this article I'm using Morphit because its functionality allows for more educational explanations.

Normalization with Morphit by Toneboosters

Morphit is built as an audio processing plugin, so by itself it can't be applied systemwide. And it is not available on Linux. I was experimenting with it on a Mac by adding it to Audacity and applying it as a filter to sine sweeps.

The task of Morphit is to apply a frequency response correction curve that changes the sound signature of certain headphone model into something else. For this, two things must be known: the frequency response of the headphones being corrected, and the target frequency response.

Morphit has three modes of operation: "Correct", "Simulate", and "Custom". The last mode is the most adjustable—it allows to specify the source frequency response, the target response, and additional correction of up to 4 parametric EQ filters. "Simulate" mode is the same, but lacks the EQ filters. "Correct" mode is the simplest one—it sets the target frequency response to "Generic studio reference". I will be using "Custom" mode as the most robust one.

On the UI, Morphit shows the correction curve, not the target. But it's easy to see the target curve as well—we need is to set the source EQ curve to flat, and the corresponding setting is called "Generic flat eardrum". So, here is how we can see what "Generic studio speaker" target setting looks like:

The only problem with the Morphit's UI is that it lacks any grids and an ability to overlay the graphs. Fortunately, we can do that in FuzzMeasure by importing the processed test signals. Here is what we get for "Generic studio reference", "Generic HiFi", and "Generic studio speaker":

The curves certainly have some similarities: low frequencies stand out above the middle range, there is a prominent peak at about 3 kHz, and after it the high frequencies start to roll off. These characteristics resemble what is known as "Harman Target Response for Headphones", and it is thoroughly dissected by the headphone expert Tyll Hertsens here. I would like to compare the attenuation values between the curves of the Harman TR, and the ones on the graph. Note that in Tyll's article the level at 200 Hz has been chosen as the 0 dB reference point, and for comparison I had offset Morphit's curves to the same level.

Freq Eardrum Harman Stud Spk HiFi Stud Ref
60 Hz 0 dB +4 dB +4.2 dB +3.6 dB +0.9 dB
200 Hz 0 dB 0 dB 0 dB 0 dB 0 dB
1.2 kHz +3 dB +3 dB +2.9 dB +1.7 dB +0.7 dB
3 kHz +15 dB +12 dB +11.9 dB +9.9 dB +8.5 dB
10 kHz +5 dB 0 dB +2.1 dB +1.3 dB +2.8 dB
18 kHz -7 dB -13 dB -9 dB -0.3 dB -8.5 dB

As we can see, the "Studio Speaker" setting of Morphit is pretty close to the Harman Headphone Target curve, but the bass on the "Studio Speaker" starts to roll off after about 38 Hz.

In his article, Tyll suggests some refinements to the Harman curve:

  • flattening the rise from 200 Hz to 1.2 kHz;
  • lowering the peak at 3 kHz;
  • adding a peak near 10 kHz that naturally occurs due to ear canal resonance.

As it can be seen, those are very similar to the differences that we can see between the "Studio Speaker" and "Studio Reference" curves. Plus, the "Studio Reference" curve offers a flat LF line from about 110 Hz and below and shifts the main peak a bit to the left: from 3.1 kHz to 3.3 kHz. The "HiFi" setting sits somewhere in between, and doesn't have the sharp rolloff at HF.

Subjective Evaluation

I performed blind testing using Shure SRH1540 headphones comparing the "Studio Speaker" and "Studio Reference" settings, and the latter was sounding better on most of the test tracks. The only drawback is that on some tracks the amplification of the 6–12 kHz region can sound too bright, adding harshness to "s" and "t" sounds. This can be heard very well on tracks "Little Wing" by Valerie Joyce and on "Hung Up" by Madonna. This is the same drawback that I experienced when listening to MBQuart 400 and Beyerdynamic T90 headphones. But with other track this brightness is usually well perceived by myself.

Note on the Implementation

I haven't found an explicit confirmation, but it seems that Morphit uses a recursive (IIR) filter. First, the plugin has only about 3 ms latency and second, the phase profile of processed waves is the same as in recursive filters that I've built myself in order to replicate Morphit's curves.

Do All Normalized Headphones Sound the Same?

I would not be expecting that despite that we are equalizing the frequency response of several headphones to the same target response. As I've mentioned in the very beginning, there are more additional parameters that define the "sounding" of particular headphones. One is the level of distortions that headphone's drivers introduce—they can change timbres of instruments by adding extra harmonics. Another is how well the drivers are balanced—this affects imaging.

As a simple experiment, I took 3 different headphone models: AKG K240 Studio, Sennheiser HD6xx (Massdrop version of HD650), and Shure SRH1540, then normalized some samples of commercial recordings to the same target curve for each of the headphones, and listened through.

The tonal balance has indeed been aligned. For example, K240 initially being very neutral, after normalization also started displaying excessive brightness of Madonna's "Hung Up" For all headphone models, the vocals have become much clearer.

But despite this sameness, I could still hear the individual characteristics of these headphones. K240's comparatively narrow soundstage didn't change. SRH1540 were still showing somewhat stronger bass than two other models due to closed earcups, and so on.

So there is no magic in normalization, it can't make bad headphones sound like the best ones, but it can be useful in situations where it is needed to remove the sound colorations added by the manufacturer to express a certain "sound signature".

Sunday, December 3, 2017

Why I Don't Save Filtered Samples as 16-bit PCM Anymore

When I need to evaluate a filter on a set of samples of commercial music in CD format, I used to render the filtered results into 16-bit PCM. The reasoning I had behind that is somewhat rational:

  • first, as the source material is in 16-bit resolution, and I'm not enhancing dynamic range, storing the processed result in anything beyond 16-bit seems pointless;
  • comparing floating point numbers is never as precise as comparing integers—integer 5 is always 5, whereas in the floating point world it can be represented either 5.00000, or something like 5.000001 or 4.999999;
  • although the immediate output from filters is in floating point format, there is a pretty deterministic procedure of converting floats into ints, unless dithering has been applied.

But as it turns out, the last statement is actually wrong. In the audio world, there is no single "standard" way for converting ints into floats and back. This is a good writeup I've found on this topic: "Int->Float->Int: It's a jungle out there!"

The first suspicions had started crawling into my mind when I was doing bitwise comparison of filtered results obtained from Audacity, Matlab, and Octave, for the same input sample, and using the same filter. To my surprise, the results were not quite the same.

Performing Bitwise Comparisons with Audacity

By the way, the bitwise comparison is performed trivially in Audacity using the following simple steps (for mono files):

  1. Open the first wave file in Audacity: File > Open...
  2. Convert the track is in 32-bit float format (via track's pop-up menu.)
  3. Import the second wave file: File > Import > Audio...
  4. Also make sure it is in 32-bit float.
  5. Invert one of the waves: select wave, Effect > Invert.
  6. Mix two waves together: Tracks > Mix > Mix and Render to New Track.

This creates a new track containing the difference between two waves in time domain. If the wave files were quite similar, viewing the resulting track in the default "Waveform" mode may look as a straight line at 0.0. In order to view the difference in the lowest bits, switch the resulting track into "Waveform (dB)" mode.

Another option is to check the spectrum of the resulting wave using Analyze > Plot Spectrum... dialog. If there is no difference, the spectrum window would be empty, otherwise some residual noise would be shown.

Note that it is very important to convert into 32-bit, because if the wave stays in 16-bit mode and there are samples with the minimum 16-bit value: -32768, upon inversion they will turn into max positive 16-bit value which is +32767. And summing them up with their counterparts from the original non-inverted track will produce samples of value -1.

So, when I was comparing filtered wave files processed in different systems with the same filter, and saved in 32-bit float format, usually there was no difference (except for Octave—as it turns out, even recent distributions of Octave, e.g. v4.2.1 are affected by this bug which saves into 32-bit integer instead of floats, and also stores 1.0 float value as minimum negative 32-bit value: -2147483648, instead of max positive). But once I started saving them in 16-bit format, the difference started to become quite noticeable. Why is that?

Determining Int16 Encoding Range

First, let's determine how Audacity, Matlab, and Octave deal with converting between minimum and maximum float and int16 values.

In Audiacity, we can generate a square wave of amplitude 1.0, which in 32-bit mode will be a sequence of 1.0 and -1.0 interleaved, like here:

After exporting it into a 32-bit float PCM wav file, it can be examined with "octal dump" (od) utility:

$ od -f aud-square32f.wav
...
0000120     1.000000e+00    1.000000e+00   -1.000000e+00    1.000000e+00
0000140    -1.000000e+00    1.000000e+00   -1.000000e+00    1.000000e+00
...

After exporting the same wave into a 16-bit int PCM wav file, it is possible to see the same values represented as int16:

$ od -s aud-square16.wav
...
0000040                                               ...   32767   32767
0000060    -32768   32767  -32768   32767  -32768   32767  -32768   32767
...

Now Matlab R2017b. After loading the square wave from a 32-bit file, it's easy to display it:

>> [float_wave, fs] = audioread('aud-square32f.wav', 'native');
>> format shortEng;
>> disp(float_wave(1:8))

     1.0000e+000
     1.0000e+000
    -1.0000e+000
     1.0000e+000
    -1.0000e+000
     1.0000e+000
    -1.0000e+000
     1.0000e+000

Then it's easy to export it into 16-bit again, and check how will it be represented:

>> audiowrite('mat-square16.wav', float_wave, fs, 'BitsPerSample', 16);

$ od -s mat-square16.wav
...
0000040                                               ...   32767   32767
0000060    -32768   32767  -32768   32767  -32768   32767  -32768   32767
...

OK, that means, Audacity and Matlab use the same range for int16 representation: from -32768 to 32767. What about Octave (v4.2.1)? The result of loading the floating point wave is the same, but what about the export into int16?

$ od -s oct-square16.wav
...
0000040                                               ...   32767   32767
0000060    -32767   32767  -32767   32767  -32767   32767  -32767   32767
...

Interesting—it turns out that Octave only uses the range from -32767 to 32767, for symmetry I suppose. It's even more interesting, that if we load a 16-bit wave file produced by Audacity or Matlab into Octave in 'native' mode, that is, without converting into float, Octave will "scale" it in order to avoid using the value of -32768:

octave:5> [mat_int16_wave, ~] = audioread('mat-square16.wav', 'native');
octave:6> disp(mat_int16_wave(1:8))

   32766
   32766
  -32767
   32766
  -32767
   32766
  -32767
   32766

Personally, I find this quite odd, as I was considering the "native" loading mode to be transparent, but it's actually not.

So, obviously, this discrepancy in the range of int16 used can be the source of difference when performing bitwise comparisons. Can there be another reason? Yes, and it's the way fractional values are rounded.

Rounding Rules

For float numbers used in calculations, there is a variety of rounding rules. I've made an experiment—created floating point wave files with series of steps, and converted them into int16 using Audacity, Matlab, and Octave. For the step, I used different values depending on what range the framework uses. Thus, 1 unit ("1u" in the table) can be different for the positive and the negative range. The results are quite interesting:

Float Audacity Matlab Octave
-1.0 -32768 -32768 -32767
-1.0 + 0.25u -32768 -32768 -32767
-1.0 + 0.75u -32767 -32768 -32766
-1.0 + 1u -32767 -32767 -32766
-1.0 + 2u -32766 -32766 -32765
0.0 - 2u -2 -2 -2
0.0 - 1.75u -2 -2 -2
0.0 - 1.25u -1 -2 -1
0.0 - 1u -1 -1 -1
0.0 - 0.75u -1 -1 -1
0.0 - 0.25u 0 -1 0
0.0 0 0 0
0.0 + 0.25u 0 0 0
0.0 + 0.75u 1 0 1
0.0 + 1u 1 1 1
0.0 + 1.25u 1 1 1
0.0 + 1.75u 2 1 2
0.0 + 2u 2 2 2
1.0 - 2u 32766 32765 32765
1.0 - 1u 32767 32766 32766
1.0 - 0.75u 32767 32767 32766
1.0 - 0.25u 32767 32767 32767
1.0 32767 32767 32767

It seems that all the frameworks use slightly different rounding rules. That's another reason why the wave looking the same in the floating point format will look differently when rendered into int16.

Conclusion

Never use 16-bit PCM for anything besides the final result for listening. And then also use dithering. For any comparisons, and for bitwise comparison, always use floats—they turn out to be less ambiguous, and retain consistent interpretation across different processing software packets.

Saturday, October 28, 2017

Re-creating Phonitor Mini with Software DSP

If you have seen my previous posts, you might remember that my plan was to recreate Phonitor Mini crossfeed within miniDSP HA-DSP. However, while trying to do that I've encountered several technical difficulties. I would like to explain them first.

First, the hardware of HA-DSP looks good on paper, but flaws in the implementation can be easily detected even using an inexpensive MOTU Microbook IIc. For starters—look, there is some noise:

Yes, it's at microscopic level, but I don't see anything like that on MOTU cards, that also employ DSP. And the resampler (recall that the DSP in HA-DSP operates at 96 kHz) adds some wiggles when working with 48 kHz signals:

Finally, I've experienced stability issues when connecting HA-DSP to Android and Linux hosts. I raised the last two issues with miniDSP support, but got no resolution.

Another technical problem came from FIR filter design software. I use FIRdesigner, and it's quite powerful and versatile tool. However, it has one serious drawback in the context of my scenario—since the Phonitor crossfeed filters are quite delicate, and have only a 3 dB amplitude at most, when modeling them, every fraction of a decibel counts. But since FIRdesigner is first and foremost designed for speakers builders, it only offers 0.1 dB precision when manipulating the source signals, and that was causing non-negligible deviations of the designed FIR filters' frequency response curve when compared to the original curves of the analog Phonitor filters.

I've been wrestling with these issues for a while, then thought the situation over, and decided to sell my HA-DSP. Having parted with it, I turned back to my initial approach of performing filtering in software.

There had been some work already done by myself for generating IIR filter coefficients to fit a given frequency response using cepstral method (based on this post by R. G. Lyons). So I have dusted off my Matlab / Octave code, and prepared it for action.

However, one important thing had to be done to the analog filter measurements—since I was performing them using MOTU Microbook IIc which lacks ideally flat frequency response, I needed to remove frequency response roll-offs introduced by it from these measurements. On the DSP language this process is called deconvolution—"reversing" application of a filter.

I've learned that it's quite easy to perform deconvolution with REW, although the command is buried deep in the UI. Big thanks to REW's author John Mulcahy for pointing this out to me!

In order to perform deconvolution in REW, two measurements first need to be imported. In our case the first measurement is the Phonitor's filter curve recorded via Microbook, and the second one is a loopback measurement of Microbook on the same output and input ports. Then, on the All SPL tab one need to open the drop down menu (the cog button), select these measurements, and choose division (/) operation. Division in the frequency domain is equivalent to deconvolution performed in the time domain.

One important thing to remember is to always save all impulse responses with 32-bit resolution because quantization errors can cause quite visible deviations of the calculated frequency responses.

Now, having nice deconvolved impulse responses, I was ready for action. Since this time I was creating a software implementation of a filter, I've got more freedom in choosing its parameters—no more was I constrainted by the sampling rate of the DSP or the number of taps on it. So I've chosen to create an IIR filter operating at 44.1 kHz sampling rate, and having 24th order.

The resulting model has turned out to be ideally close to the target filter. Note that on the plot, the offset of the curves for the direct and the opposite channels isn't correct—this is because during deconvolution, the amplitudes of the filters were normalized by REW. Never mind, it's easy to fix.

In order to figure out what is the offset between the direct and the opposite channel filters, I used a nice feature of FuzzMeasure's interactive plots—after clicking a point with "Option" key pressed, FM shows both the variable value (frequency in this case), and the corresponding values of the displayed graph, with precision of 3 digits after the decimal point. So it was quite easy to find out what is the difference between the filter curves for the direct and the opposite channels.

Using this information, I was able to fix the offset of my curves, and finally was ready to process some real audio. I've chosen a short excerpt form Roger Waters' "Amused to Death" album, where a lot of different kinds of sounds present: male and female vocals, bass, percussion, guitars, etc. The recording quality is outstanding, plus the final result was rendered using QSound technology which uses binaural cues for extending the stereo base when listening on stereo speakers. It's interesting that when listening on headphones without crossfeed, all these cues do not work due to "super stereo" effect. But they start working again with crossfeed applied.

For blind tests, I've passed a fragment of "Perfect Sense, Pt. II" song through a rig of Phonitor Mini connected via Microbook. First in its original form, but with Phonitor's crossfeed applied, and then after processing via the IIR filter I have created, with crossfeed on Phonitor turned off. This way, the difference between these recordings were only in the implementation of the crossfeed effect.

Below are the links to the original recording, the one processed with Phonitor's own crossfeed, and with my digital re-implementation of it (make sure to listen in headphones):

Original | Phonitor crossfeed | IIR implementation

In my blind test, I couldn't distinguish between the original crossfeed and my model of it (two last samples).

Then I wanted to try to process a couple of full length albums. Here I've got a little problem—the way sound processing is organized by default in Matlab and Octave doesn't really scale. There is a function called audioread for reading a portion of audio file into memory in uncompressed form (and there must be a continuous region in memory available for allocating the matrix that contains the wave samples). And there is a complementing function called audiowrite which writes the result back to disk. However, it would require creating custom code in order to read the input file in fragments, process it using the filter and write back.

I decided to do something different. Since I anyway was planning applying a headphone normalization filter in Audacity, I though it would be convenient to perform crossfeed processing in Audacity as well.

There is an entire scripting language in Audacity hidden behind Effects > Nyquist Prompt... menu item. The script "sees" the whole input wave as a single object, but behind the scenes Audacity feeds to the script bite-sized chunks of the input file. That's the abstraction I wanted. So I wrote a Matlab script that transforms my high-order IIR filter into a sequence of biquads, and generates a Nyquist Prompt script that performs equivalent processing.

Since biquad filters are implemented in Nyquist Prompt in native code, even a sequence of 12 biquads gets applied quite quickly, and the entire CD is processed on my modest Mac Mini 2014 in slightly more than a minute. The generated Nyquist Prompt script is here. Note that it is needed to enable "Use legacy (version 3) syntax" to work with Lisp code.

One caveat was to avoid losing precision while applying the sequence of filters. My initial mistake was to export the biquad coefficients with just 6 digits after the decimal point—the processed file was sounding awful. Then I enhanced precision, and diffed the sound wave processed in Audacity with the same wave processed in Octave. The diff wave only contained some noise below -100 dBFS, and the two processed audio samples were now indistinguishable in a blind test.

I have mentioned headphone linearization before. With ToneBoosters Morphit performing linearization is straightforward assuming that measurements of your headphones are in Morphit's database. My first impressions after listening to processed audio samples was that Morphit thins out bass considerably. I've compared Morphit's equalization curves with Harman's Listener Target Curve for headphones and found that the former lacks the bump in the bass area featured in the latter.

So I've switched to custom mode in Morphit, and compensated the applied shaving off of the bass with a shelf filter:

The resulting audio sample sounded much better both than the original version processed with the crossfeed filter (due to more prominent vocals and percussion), and definitely better than the initial linearization by the factory Morphit filter for Shure SRH1540.

By the end of the day, I've created processed wavefiles of some quality recorded albums I have on CDs, and uploaded them into my Play Music locker for further evaluation. I didn't notice any harm from the compression to 320 kbps. Now, would I enjoy this crossfeed+Morphit processing on the albums I know well, I will find a way to apply the processing in real time to all sound output on my Linux workstation.

Monday, September 11, 2017

Challenges While Performing Crossfeed Measurements

Since I've started working on the SPL Phonitor Mini crossfeed filter replication, I've learned so many things that I will need several posts in order to describe them all. Let's start with the analog part.

Channel Imbalance

As I've mentioned in the previous post, I have a goal of replicating Phonitor Mini crossfeed settings using DSP in HA-DSP. The first task I was faced with was performing accurate measurements of Phonitor's filters. They are quite delicate—the amplitude of the filters doesn't exceed 3 dB, and the attenuation of direct vs. opposite channels need to be replicated. Not surprising, this task required a lot of attention to the details. Especially when using budget hardware (I use MOTU MicroBook IIc as my capturing tool) which has limits on the precision it can provide.

In addition to being delicate, crossfeed filters involve signal summing due to partially mixing signals from the left and right input channels. This can be a problem when using inexpensive sound card for measurement, thanks to slight channel imbalance. As an example, below are the measurements of all the combinations of "Main" output and "Line" input channels on MicroBook:

It's easy to see that no pair matches exactly in the recorded signal level. What that means to our crossfeed measurements, is that even if we ignore own channel imbalance of Phonitor Mini (which is also present in reality), the records of the sum of left and right channels (from crossfeed) captured by left and right inputs of MOTU will have different levels.

Unfortunately, the input and output attenuation controls on MicroBook, despite being digital, do not provide required resolution in order to compensate these offsets. This also means that one needs to be careful with performing calibration of the soundcard—there need to be separate calibration profiles per input / output channel combination.

I wasn't particularly happy with the discovered lack of balance, so I decided to try other inputs and outputs, as MicroBook has several of them. This time I used unbalanced line output, and "Guitar" input. Since it's a mono input I used a Y-cable 3.5 mm TRS into two 1/4" TS, connecting each one of them in turn. This time the channels balance was much better, just 0.003 dB offset:

It may appear as if the second graph has a much steeper rolloff on ends, but this is only because this time I've magnified more along the vertical scale. When placed next to each other, the graphs do not show such a dramatic difference:

Using the "Line to Guitar" configuration, I connected MOTU's unbalanced line out to Phonitor's unbalanced input, and one channel of Phonitor's headphone output again via a Y-cable to the guitar input. This is how "flat" Phonitor (no crossfeed applied) measures in this setup:

Note that the channel offset is now about 0.015 dB instead of 0.003 dB of the loopback connection, due to slight imbalance introduced by Phonitor.

On headphone amplifiers the channel balance usually skews as volume level changes (unless it's a super expensive super precise amplifier, apparently the Mini isn't one). It's anyway unknown how the crossfeed circuit affects channel balance, so I decided not to try to find a volume knob position providing a smaller offset, having that this volume position gives me the highest signal level without the need to engage the amplifier on the guitar input, which would contribute to non-linearity and noise.

It's worth mentioning that Phonitor didn't change the shape of the curve. Plotted on the same graph, its response covers the loopback response exactly. That's great—this is what you expect from a "transparent" audio equipment.

Noise

Another problem I faced was noise. Since for measurements I have to connect several pieces of electrical equipment together, this creates a possibility for ground loops to appear. There is a great article by Bill Whitlock on the origins of ground loops, available for free download here (need to apply for a free registration first).

For example, when measuring Phonitor (which is a stationary amplifier), I had to disconnect the laptop running measurement software from AC power, since otherwise a ground loop was created via two connections to mains power.

More challenging was avoiding ground loops when measuring HA-DSP. It runs on battery power, but unlike Phonitor contains its own DAC, which means I had to connect it to USB port of the same laptop. This creates a ground loop via two USB connections (from MOTU and HA-DSP). In fact, the noise level introduced by this loop was about 30 dB(Z), I had to get rid of it. I've considered several ways to do that:

  1. Instead of USB, use optical input on HA-DSP. But the issue with this approach is that MicroBook doesn't provide an optical output, only coaxial, so I had to add another piece of equipment in order to do conversion. Also, my preliminary experiments using the optical output of Mac Mini have shown that HA-DSP has an additional brickwall filter at about 24 kHz on this signal path (even if the TOSLINK connection is operated at 96 kHz).
  2. Instead of USB or optical input, use the analog output on MOTU connected to analog input on HA-DSP. Since MOTU provides a good separation of audio and USB grounds, this connection doesn't introduce a ground loop. But the obvious drawback is that it involves additional A/D conversion on HA-DSP, and it's also limited to 24 kHz frequency top range.
  3. Use USB, but insert an isolating transformer after analog output of HA-DSP. The issue with an isolating transformers it that they are non-linear, except for really expensive ones. Since we are doing audio measurements, it would be inconvenient to insert a distorting component.
  4. Use USB via USB isolation. Obviously, doesn't introduce any analog distortions, but the issue with the majority of USB isolators is that they are based on Analog Devices ADuM3160 and ADuM4160 chips, which are limited to USB "Full Speed". In theory, Full Speed should provide bandwidth enough to pass 96 kHz / 24-bit stream, but in practice, High Speed USB DAC chips fall back to 48 kHz / 24-bit if the connection can't provide bandwidth enough for 192 kHz / 24-bit. This is true for HA-DSP. There are a couple of High Speed USB isolators, but they cost about 4x times compared to a normal Full Speed isolator.

I decided to go with the option 4, and bought a Full Speed isolator from USConverters. After all, 48 kHz impulse response can be upsampled to 96 kHz (this is the operating rate of HA-DSP) easily.

Below is the plot of measured channel imbalance of HA-DSP output from USB, at 48 kHz, with DSP bypassed:

As it can be seen, the channel offset is about 0.04 dB—that's considerably more than of Phonitor. Another issue is more noise—it can be seen on an unsmoothed plot. And that's even after making 5 consecutive measurements and averaging them.

Yet another issue is different roll-off at high frequencies:

As it can be seen, the difference at 20 kHz is about 0.9 dB! Recall that the same input was used on MOTU, so the difference is definitely due to HA-DSP. Fortunately, this can be compensated as part of filter design process.

UPDATE 9/14/2017: Turns out, the early roll-off for HA-DSP is an artefact of averaging of measurements. In fact it's not that bad, I'll publish updated measurement graphs in the next post.

Conclusion

I think that's enough for now, and it's just the beginning of my findings! Will publish more soon.

Thursday, August 24, 2017

MiniDSP HA-DSP First Impressions

Being an audio geek I couldn't ignore this promising gadget from MiniDSP. To me, MiniDSP products were always associated with loudspeaker and room digital correction, but unexpectedly they have tried their design skills in a relatively niche area of portable DACs and headphone amplifiers. And thanks to their vast DSP experience, the resulting product has come out very interesting and highly unique.

There is a very good description of HA-DSP from the manufacturer. I will give my own version of it, coming from the possible range of functions that this device can perform:

  1. HA-DSP can be used as a regular portable headphone amplifier taking analog input. Unfortunately, HA-DSP can't also be used as a power bank despite presence of a deceptively looking USB-A port on it.
  2. Since HA-DSP has USB inputs and is USB Audio Class compliant, it can also be used as a portable DAC for mobile devices and computers. However, I've encountered issues when I tried using it with some Android devices leading to mobile device reboots.
  3. The 3.5 mm analog input port of HA-DSP also accepts mini-TOSLink jack, allowing to connect HA-DSP to audio gear that has optical output. Note that both analog and optical input has a cutoff frequency at 22050 Hz, even if the output device provides a full range signal.

However, you can find numerous other portable DACs that can fulfill all these scenarios and don't have the drawbacks I've mentioned. What makes HA-DSP unique is the "DSP" part in it's name. If you know how to create FIR and IIR filters, this little box offers a lot of room for audio experiments, for example:

Make precise output frequency response adjustments using 10 bi-quad IIR filters per channel.

Create arbitrary crossfeed effects with two parallel blocks of FIR filters and cross-commutation.

Apply headphone target curve correction with FIR filters.

Switch between 4 configurations of the filters that can be tied to different headphone models and crossfeed settings.

My own plan for this box is to replicate Phonitor Mini crossfeed filter, and also to experiment with headphone correction based on the headphone measurements from Inner Fidelity database and Isone MorphIt filter.

I've already mentioned some drawbacks of HA-DSP. Another issue I discovered while making measurements is some non-linearity of the frequency response. My measurements of HA-DSP using MOTU Microbook IIc have shown early roll-off in high frequency range. Below is a frequency response of HA-DSP (blue) compared to Microbook's own (orange):

On this graph, the HA-DSP's response plot uses Microbook calibration from a loopback measurement. The good part, however, is that this roll-off can be corrected using the on-board DSP as part of FIR filters design.

Conclusions

HA-DSP is definitely a device targeted to audio geeks. One would probably need to carefully consider whether they would be able to use it to full extent. If designing filters isn't your hobby, there are definitely better alternatives in terms of cost and quality.

Wednesday, July 5, 2017

Wiistar 5.1 Audio Decoder Teardown

For some experiments that require hardware decoding of Dolby Digital I've acquired a cheap Chinese 5.1 decoder on Amazon—it costs just $24 so there was not much hesitation while buying it.

The good news is that it's indeed a proper Dolby Digital (AC3) decoder, which also supports upmixing of stereo channels into 5.1 (probably using Dolby Prologic). The bad news is that the quality of the audio output is... consistent with the price of the device.

I've found a post by Alexander Thomas describing previous versions of this device. Compared to what Alexander had observed, the hardware I've bought seems to be somewhat newer:

  1. Instead of CS4985 decoder chip it uses an unidentified DSP chip of a square form.
  2. There is no filtering of the output signals or any "bass management" (sinking of low frequencies from the main channels into the subwoofer's channel).
  3. The unit is powered from a 5 V source instead of 9 V.
  4. The unit provides a 5 V USB power outlet.

There are still some similarities though:

  1. LFE channel lacks +10 dB boost expected by the DD spec.
  2. The board's ground is not connected to the case.

Hardware Teardown

Now let's take our screwdriver and see what's inside the box. This is how the board looks like:

Most of the components are mounted on the top side. Some of the major components can be identified:

  • [1] 4558D is a stereo opamp, this make is by Japan Radio Company (JRC);
  • [4] ES7144LV is a stereo DAC—the board employs three DAC / opamp pairs;
  • [7] 25L6405D chip is flash memory;
  • [6] NXP 74HC04D is hex inverter chip;
  • [2] AMS1117 is power regulator.

There are two mystery chips:

  • [5] the big one labeled VA669—I suppose that's the decoder DSP, having that there are traces coming from it to the DACs, but the actual make and model of the chip are unknown;
  • [3] the one labeled "78345 / 8S003F3P6 / PHL 636 Y"—judging by its position on the board, it could be a microcontroller handling input selection and "5.1 / 2.1" switches.

And this is the bottom view:

One interesting thing to note is that the labels and holes suggest that this board can be equipped with RCA output jacks per channel, as an alternative to three 3.5" stereo jacks and the 5 V USB outlet. This suggestion is confirmed in the manual:

Measurements

I was wondering whether this device can be used in any serious setup, and for that I've hooked this device up to the inputs of MOTU UltraLite AVB audio interface.

I needed a test sound file that is AC3-encoded and contains measurement sweeps in all 6 channels. For that purpose, I took the measurement sweep file generated by FuzzMeasure, and used Audacity in order to create a 6-channel file with a sweep in each channel:

Note that ffmpeg library which is used to encode AC3 applies a lowpass filter to the LFE (4th) channel. This will prevent us from seeing the full performance of the LFE channel on the device.

Using a TOSLINK cable I hooked up the device to MacMini's optical output, played back the encoded file, and recorded the decoded analog output using MOTU.

The first thing I discovered was that the surround channels are swapped. That is, they use a reverse of the standard TRS stereo channels mapping where the left channel is on the "tip" contact plate, and the right channel is on the "ring". Instead, the left surround is on the "ring", and the right surround is on the "tip". Perhaps, this was done on purpose to undo the reversal of "left" and "right" if one sets the surround speakers facing him, and then turns around :)

The next discovery was quite a bad shape of the output waves. As one can see, the sine wave is severely clipped at bottom half-waves. This is how the source -3 dBFS sine wave has been rendered:

Input sine wave with smaller amplitude (-6 dBFS) is clipped a bit less:

This is very unfortunate, and is probably caused by a bad design of the output stage. Looks like using the 4558 opamp wasn't the best choice in the first place, and the designers of this board seriously hindered its performance by failing to drive it correctly.

After looking at these horrible output sinewaves, I wasn't expecting a good frequency response, and indeed it's quite bad. Below are the plots for the left channel from a -3 dBFS input signal (blue), and for -6 dBFS input (orange), no smoothing:

The measurements for the remaining channels are the same as for the left—at least this device is consistent for all channels. Below is left channel (blue) vs. LFE channel (yellow):

This plot confirms that the LFE channel has the same output level as other channels, lacking the required +10 dB boost.

It's very funny to look into the "Technical Data" section of the manual for this device, stating:

Frequency Response: (20 Hz ~ 20 KHz) +/- 0.5db

The authors tactfully omit the level of the input signals used in this measurement (if it actually was performed)—probably the level wasn't too high.

Conclusion

Looks like this family of devices can't be used in any serious setup. It will be interesting though to try to reverse engineer the electrical design of this board, and fix obvious flaws.

Sunday, June 25, 2017

Little Toolbox for Stereo Filters Analysis

Since I'm very interested in studying different implementations of crossfeed filters, I came up with a little toolbox for GNU Octave that helps me to compare and decompose them.

Although some of this analysis can be performed using existing software tools, such as FuzzMeasure (FM) or Room EQ Wizard (REW), my little toolbox offers some nice features. For example:

  • convenient offline processing—analyze the filter by processing stimulus and response wave files; although this functionality exists in FuzzMeasure (but not in REW), it isn't very convenient for use with binaural filters like crossfeed, because FM assumes stimulus and response to be mono files;
  • microsecond precision for group delay; both FM and REW show group delay graphs, but their units of measurement is milliseconds (makes sense for acoustic systems), whereas in filters induced delays are usually thousand times smaller;
  • IIR filter coefficients computation from frequency response.

The toolbox supports different representations for the filter specification:

  • a pair of stimulus and response wave files; the stimulus file is a stereo file with a log sweep in the left channel; when this file is processed by a typical crossfeed filter, the response wave file is also stereo, and receives the processed signal in both channels with different filters (that's the essence of crossfeeding);
  • a csv file with frequency response of a filter (magnitude response and phase response) for both channels, or two csv files one per channel;
  • IIR transfer function coefficients (vectors traditionally named "B" and "A") for each channel, and the attenuation value for the opposite channel.

The functions of the toolbox can convert between those representations, and plot frequency response and group delay for both channels, and for a pair of filters for comparison.

Usage Example

Let's perform an exercise of applying these filters to the BS2B implementation of crossfade filter. Although there is a source code and a high level description of this implementation, we will consider the filter to be a "black box", and see if we can reverse engineer it.

Preparing Stimulus File

We need a sine sweep from 20 Hz to 20 kHz in order to cover the whole audio range. It turns out, that generating a sweep that best suits our task is not as easy as it might seem. The sweep wave must be as clean as possible (free of noise and other artifacts). Audacity can generate sine sweeps, but the produced signal contains aliasing artifacts that can be clearly seen on the spectrogram. REW also can generate sweeps, and they are free from aliasing, but the log sweep it's not perfect on the ends.

The best sweep I was able to find is generated using an online tool called "WavTones". Here are the required settings:

The downloaded WAV file is mono. For the purpose of analyzing the crossfeed filter, we need to make a stereo file with the right channel containing silence. We will use Audacity in order to make this edit.

But before doing any editing, let's make sure that Audacity is set up properly. What we need to do is to turn off dithering, as otherwise Audacity will inject specially constructed high-level noise when saving files. This usually improves signal-to-noise ratio when playing them, but for us this is undesired, as it will result in contamination of the frequency response with noise. Turning off dithering is performed by setting the "Quality" preferences as follows:

Now we can load the mono log sweep file generated by WavTones, add a second track, and generate silence of the same length as the log sweep. Then make the sweep track "Left Channel" and the silence track the "Right Channel" and join them into a stereo track. The resulting stereo sound wave should look like as below. It needs to be exported as a 16-bit WAV file.

Preparing Response File

I'm using the OS X AudioUnits BS2B implementation assembled by Lars Ggu (?). Audacity can apply AudioUnit filters directly:

After applying BS2B to our stimulus stereo wave, the resulting wave (filter response) looks like this:

As it can be seen, in the response wave the left channel has low frequencies attenuated, whereas the right channel contains a copy of the source wave passed through a low-pass filter, and also attenuated, but by a different value.

Plotting Frequency Response and Group Delay

With my toolbox, this is a straightforward operation. The function plot_filter_from_wav_files takes two stereo wav files for the stimulus and the response, and produces a plot in the desired frequency range:

There is a noticeable jitter in the opposite channel's graph starting at about 2000 Hz mark which is especially visible on the group delay plot. I'm currently working on implementing better smoothing. This is the code of the script that produces these graphs:

fig = plot_filter_from_wav_files(
  [20, 20000],                                % frequency range
  'sweep_20Hz_20000Hz_-6dBFS_5s-LeftCh.wav',  % stimulus file
  'bs2b-sweep_20Hz_20000Hz_-6dBFS_5s.wav',    % response file
  [-14, -1],                                  % amplitude response plot limits
  [-100, 300],                                % group delay plot limits
  200);                                       % gd plot smoothing factor
print(fig, 'plot-bs2b.png');

The plots do correspond with the filter parameters we have specified: the difference in amplitude between direct and opposite channels feed is 4.5 dB, and the opposite channel lowpass filter achieves -3 dB attenuation at 700 Hz. This also corresponds with the original plots on the BS2B page for this filter setting, except that the group delay there is plotted upside down (due to a wrong sign in the group delay calculations in the script provided).

Cross-check with FuzzMeasure

Since FuzzMeasure also allows offline stimulus-response analysis, I've cross-checked the results with it. FM also provides fractional octave smoothing which gets rid of those nasty jitters I have in the plots produced by my Octave scripts:

As I've noted earlier, FM use milliseconds instead of microseconds for group delay. Another inconvenience was the need for saving left and right channel responses as separate audio files.

BTW, FM also produces good quality log sweep waves which can be reliably used for analysis. But the stimulus file generator can only be parametrized on the sampling frequency, and file bit depth.

To Be Continued

This was a very simple example, I will come up with more interesting cases in upcoming posts.

Sunday, May 14, 2017

Clipping In Sampling Rate Converters

In my last post, I investigated clipping of intersample peaks that happen in DACs. But as I had started exploring the entire path of sound delivery, I discovered that digital sound data can arrive to DAC already "pre-clipped". And thus even a DAC with headroom will render it with audible inharmonic distortions.

Theory

The reason behind this is inevitable sample rate conversion when sampling rates of the source material and of the DAC do not match. Unfortunately, this happens quite often because during the evolution of digital audio multiple sampling rates come into use. The major "base" sample rates are 44100 Hz originating from CDs (Red Book Audio standard), and 48000 Hz coming from digital video. Plus, there are whole multiples of those rates: 88200, 176400, 96000, 192000 etc.

Having this variety, it's not surprising that sampling rate converters are ubiquitous. Without them it would be impossible to correctly play, say a 44100 Hz CD audio via a 48000 Hz DAC—the source audio will be rendered with wrong rate and will have incorrect pitch.

But doing the conversion isn't trivial. What sample rate converter has to do is basically render the sound wave into a mathematical curve, and then resample the values of this curve using the target sample rate. The problem that can occur here is that in a sound wave normalized to 0 dBFS the points of the target sample rate can overshoot this limit.

For example, below is a graph of a 11025 Hz sine wave at 45° phase shift sampled at 44100 Hz (blue dots), and sampled at 48000 Hz (red dots):

As you can see, at the 48 kHz sampling rate the dots are closer to each other, and some of the red dots have values of above (or below) the margins of the original 44.1 kHz sampling rate.

Had the source wave 44.1 kHz wave been normalized to 0 dBFS, the blue dots that currently have approximate values of 0.5 and -0.5 would be at 1 and -1, respectively. Thus, the values of the 48 kHz sampling would end up above 1 (or below -1). Which means if the converter is using integer representation for samples (16-bit or 24-bit), and doesn't provide headroom, it will not be possible for the converter to render those values, as they will exceed the limit of the integer. Thus, they will be clipped, and this will result in a severe distortion of the source wave.

The same thing can happen in a conversion from 48 kHz down to 44.1 kHz, or when upsampling from 48 kHz to 96 or 192 kHz. Basically, any conversion that results in emerging of new sample values can produce values that exceed the peak value in the source wave. The only potentially "safe" conversion is when the source wave get downsampled to a whole multiple, e.g. from 96 to 48 kHz, because this operation can be performed by simply throwing out every other sample.

Practical Examples

Google Nexus Player

Here am examining sound paths that I have at home. Let's start with Google Nexus Player. It's a rather old thing, and I don't think it pretends to be a "Hi-Fi" player, but nevertheless I use it from time to time, and I would like to see what it does to sound.

This is my setup: the HDMI output from Nexus Player goes into an LG TV, and it separates audio via TOSLINK connection that goes into E-MU 0404 music interface, and then to SPL Phonitor Mini. As in the last post, for measurements I will be using E-MU Tracker Pre card connected to a laptop on battery power.

I use two sound files for test: one is the same as the last time (11025 Hz sine wave at 45° phase in a 44.1 kHz FLAC), and another is 12 kHz sine wave at 45° in a 48 kHz FLAC. Both files were uploaded to my Play Music locker. I'm aware that Play Music uses lossy 320 kbps MP3 on their servers, but for these simple sine wave files this generous bitstream is effectively equivalent to lossless. At least, Play Music doesn't perform any resampling.

Since TVs are designed to be used with video content, their preferred sampling rate for audio is 48 kHz. I haven't found any way to change that setting for my TV. So first in order to test the signal path, I played the 12 kHz sine wave file (48 kHz SR), and captured it from the line output of E-MU 0404 also using 48 kHz sampling rate on Tracker Pre. The result on the frequency analysis is a beautiful clean peak at 12 kHz with no distortions at all:

However, 48 kHz isn't the typical sampling rate for the content on Play Music store—since their source is CD content, most of the albums are using 44.1 kHz sampling rate. Even YouTube uses 48 kHz sampling rate audio as I have discovered (I've checked with VLC player, it can open YouTube video streams). Not sure about the sampling rate used in Play Movies, though.

So let's now play the 44.1 kHz sine wave file using the same setup. The only change I've made is setting the capturing sampling rate to 44.1 kHz on Tracker Pre. And the result is pretty ugly:

If I wasn't really happy about how the frequency analysis looked for Benchmark DAC1, this one simply made my hair stand. The resampler in Nexus Player clips severely. What's even worse, there is not much I can do about that, since there are no controls over digital attenuation or sampling rate. Too bad. At least now I know why snare drum on "Gasligting Abbie" by Steely Dan doesn't sound good when played via this setup.

Dune HD Smart H1

I also have an old Dune HD player connected to the same LG TV. Unlike Nexus Player, Dune offers a lot of control over playback. It also supports FLAC format. Again, I started with playing a 12 kHz sine wave at 48 kHz SR just to make sure that the sound path is clean, and it was all OK.

Then I played a 11025 Hz sine at 44.1 kHz SR, and again got a lot of distortion (although the level of distortion peaks is lower than on Nexus Player):

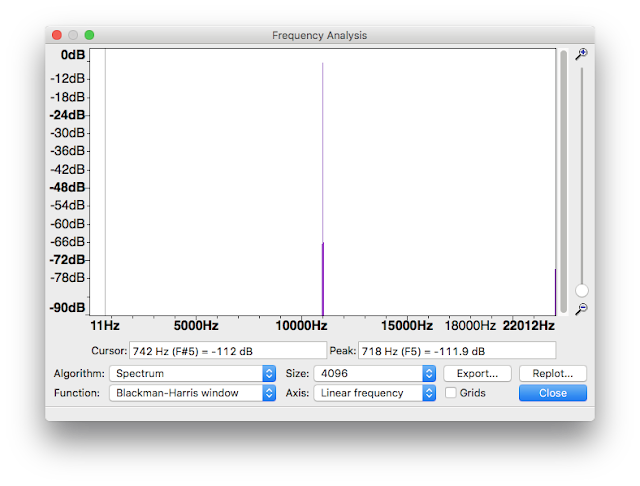
But here at least I can do something to fix that. I can't change the sampling rate, but Dune offers digital volume control, even in dB scale. I used it to reduce the volume by 4 dB down, providing enough headroom for the resampler, and the result is a beautiful clean 11025 Hz peak:

Great, now I have much more confidence in my setup.

PC-based Playback

By PC I mean Macs as well. On desktops and laptops there is a lot more control over the parameters of the digital audio signal path—it's easy to change the sampling rate on the DAC to match the sampling rate of the source material, also the majority of digital players offer digital attenuation. So there is no problem ensuring that nothing clips the digital signal on its way to the DAC.

The practical advice here is—if you are not sure about the sampling rate of the source material, use the digital volume control on the player to reduce the volume and thus provide some headroom for the sampling rate converter. Setting volume down to -4 dB (or about 80-85% if the volume control uses percents) should do the job.

Conclusion

Sampling rate converters are ubiquitous, and conveniently adapt the source audio stream to ensure that it will play regardless of the sampling rate set on the DAC. However, as we have found out, they are not transparent and can easily clip intersample peaks, thus producing audible inharmonic distortions.

To avoid that, make sure the sampling rates match between the played material and the DAC, or at least reduce the digital volume a bit to offer some headroom for the sampling rate converter.